MaxGauge for CloudDB is a database-specialized monitoring solution that can comprehensively manage cloud-based commercial/open-source databases. Multiple databases can be monitored on one screen through 1-URL Platform integration, and intuitive UI/UX enhances users’ convenience and supports operation and analysis focused on cross-linkage analysis. It can be used in various cloud environments including AWS, Azure, OCI, and GCP.
MaxGauge for CloudDB is designed to enable meaningful monitoring with minimal data according to the cloud environment.
Real-time Monitoring
Real-time monitoring
of various performance indicators
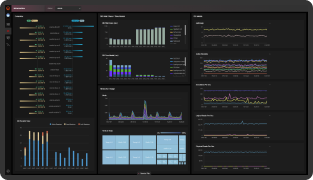
Integrated Dashboard
Provide an integrated dashboard
for the entire DBMS
1-URL Platform Integrated Monitoring
for Oracle, PostgreSQL, MySQL, etc.
User Interface
Data Scale In/Out analysis
through time series zoom chart
Alarm/SMS Connection
Alert setting for all performance indicators
User Management
List management by DBMS vendor,
client account authority setting
DB Performance Report
Select/Combine all UI provided by MaxGauge
Cloud Environment Support
AWS, Azure, OCI, GCP, etc.
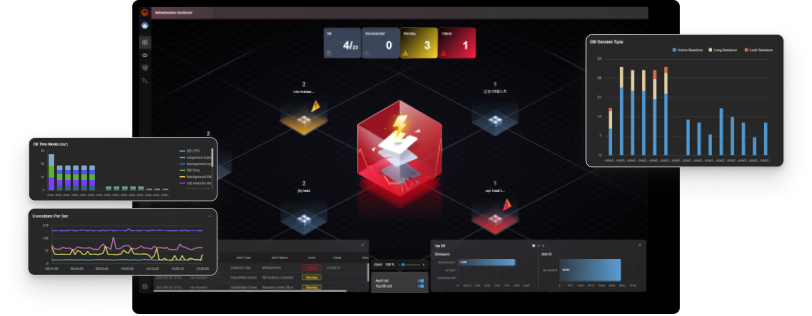
Monitoring Views
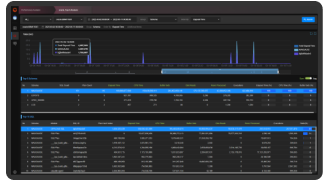
Real-time View
MaxGauge for CloudDB allows DBAs to intensively monitor a single database while taking a closer look at multiple databases on one screen. OS & DB Metric, Latency (+TPS), Wait Class, Resource Usage, Wait Chains, and other SQL Summary information can be easily checked, which enables seamless database monitoring.
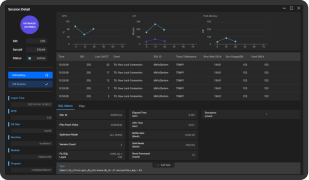
Session and SQL-related metrics, plans, and full text that require detailed analysis are provided in a drill-down method. In addition, MaxGauge for CloudDB provides the trend of major monitoring indicators, the history of the past 1 minute, and the Kill Session function.
Analysis Views
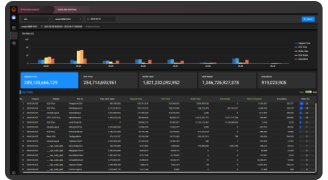
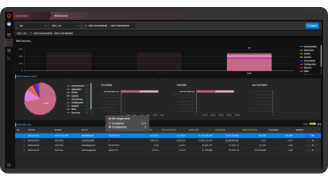
SQL Summary
The ratio of key performance indicators by date gives users a very intuitive analysis. What’s more, through Daily-Time Ratio Bar, DBAs can select/deselect the information of the desired date and identify the cause of the load by checking the Top SQL of the selected date.
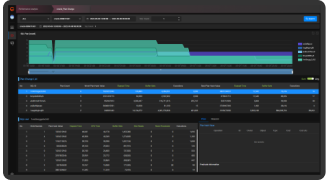
TOP-N Analysis
Through TOP-N trend analysis by section, the impact of the total or selected TOP SQL can also be confirmed. You can immediately check TOP-N data by Schema/Module/SQL when moving a section according to the search conditions, such as Group/Order by.
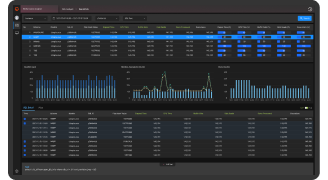
Plan Change
MaxGauge for CloudDB provides the number of SQLs changed in the plan and the trend over time. In addition, it is easy to check the plan change history, amount of work before/after the plan change (such as buffer gets, disk read), SQL Plan, and Reason information for the section. The Plan Diff feature allows you to compare two execution plans on one screen.
Event Analysis
MaxGauge for CloudDB provides the number of SQLs changed in the plan and the trend over time. In addition, it is easy to check the plan change history, amount of work before/after the plan change (such as buffer gets, disk read), SQL Plan, and Reason information for the section. The Plan Diff feature allows you to compare two execution plans on one screen.
Search SQL
MaxGauge for CloudDB provides the number of SQLs changed in the plan and the trend over time. In addition, it is easy to check the plan change history, amount of work before/after the plan change (such as buffer gets, disk read), SQL Plan, and Reason information for the section. The Plan Diff feature allows you to compare two execution plans on one screen.
Architecture
Customer Cases
Online Service
E-commerce System
Adoption Background
As the use of Cloud DB increases, difficulties in performance monitoring and management gradually occur, and then we were trying to find a solution which can help us derive causes/analysis when bottlenecks arise.
Benefits
• CPU usage reduction by SQL tuning through extraction of Top-SQL with high usage and derivation of Function in problem section.
• Reducing I/O-related costs by transferring low-critical tasks to RDS by checking SQL with a high share of disk I/O through the Top-N function.
• Transferring backup object data that is not used for operational tasks by deriving objects with high I/O-related indicators in a specific time period.
• Cost savings of KRW 570,000 per day on average and KRW 17 million per month after the adoption of MaxGauge for CloudDB.
Elevate Your IT Stability,
with EXEM Solutions.
Thank you for your contact
and we will reach out to you soon!