InterMax
End-to-End Performance
Management Solution
Enabling Full Transaction Tracing
InterMax is an application performance monitoring solution for integrated and efficient performance management of all sections, including application and database servers, through end-to-end transaction tracing for various customer environments. In a complex business service environment composed of N-Tiers, InterMax provides end-to-end transaction tracing from user request to internal WEB-WAS-DB-external system connection section (such as EAI/FEP).
Features
InterMax is designed with a stable and proven architecture which is capable of horizontal expansion even when controlling large-scale systems such as finance, public, telecommunications, and manufacturing.
-
- Integrated Monitoring of All Sections
- Including user, WEB, WAS, TP, external connection
-
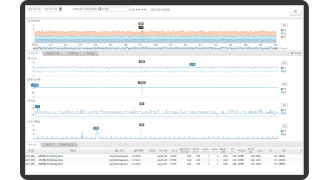
- End-to-end Transaction Tracing
- Call trace for individual transaction units
-
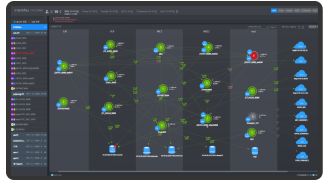
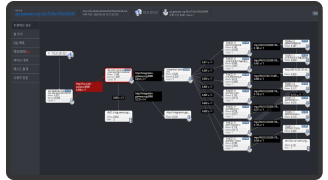
- Topology Monitoring
- Provide real-time service call relationship
and execution status dashboard
-
- Memory Leak Tracing
- Trace/Analyze memory leaks
of objects used by the application
-
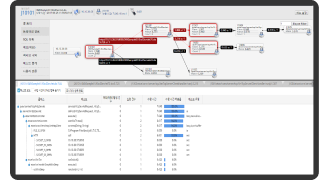
- Ranking Analysis
- Daily analysis of performance
fluctuations by transaction/SQL
-
- Linkage with DB Monitoring Solution
- Detailed session linkage analysis
with MaxGauge
-
- Linkage with Mobile App
Monitoring Solution - Individual transaction linkage tracing
with InterMax for Mobile
- Linkage with Mobile App
-
- Cloud Environment Support
- Scale In/Out linkage
for various PaaS environments
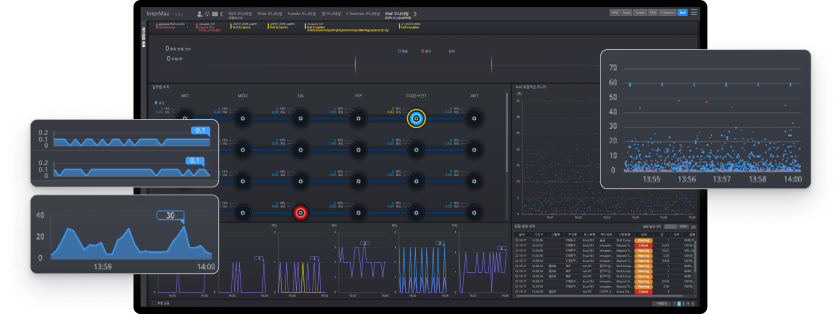
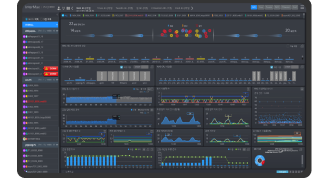
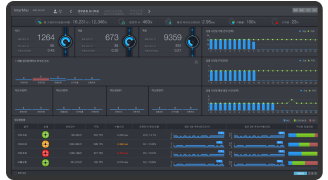
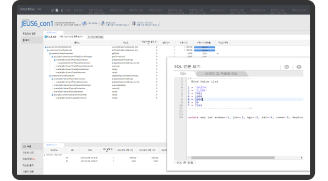
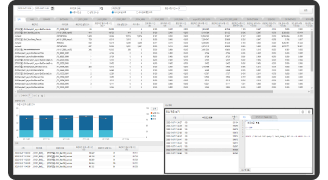
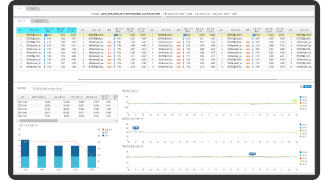
Monitoring Views
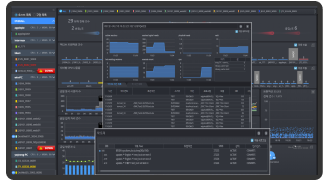
Analysis View
Architecture

Customer Cases
-
Bank
Company-wide Integrated Business System
Adoption Background
It is necessary to establish an integrated monitoring system and we definitely want an end-to-end transaction tracing system instead of separate monitoring for each business tier.
Benefits
• Improving the response speed of company-wide business system failures and problems, minimization of system downtime, reduction of bottleneck failover.
• Improving service quality to the public through clear tracing, analysis, and action on the causes of performance delays.
• Intensive analysis when a failure occurs results in a drastic reduction of over 30% of the time to take response.
• Efficiency in manpower operation and budget savings after adoption of InterMax.
-
Public
Next-generation Project
Adoption Background
We need an APM solution for monitoring and optimizing application performance when building our core business system.
Benefits
• Significant contribution to performance improvement by analyzing and deriving clear causes of application performance bottlenecks for various development environments and packaged development tools.
• Rapid failure response system is provided by establishing an integrated dashboard with DB monitoring solution.
• Prompt failure response system is provided by immediately checking the cause of performance delay and lock occurrence status through real-time monitoring.
• In terms of performance management, it provides more information than what we were looking for with minimum load on the system.
-
Card
Digital Channel System
Adoption Background
When it comes to building a cloud-based, non-face-to-face channel system, a hybrid integrated monitoring and transaction tracing system including the existing on-premise environment are necessary for us.
Benefits
• Contribution to successful system opening by improving performance through detailed tracing and analysis of applications in the latest development environment.
• Satisfaction of developers and operators by maximizing utilization in all processes of new system construction (including Development/Test/Open).
• Improve service satisfaction by immediately analyzing and taking action in case of service delay through real-time monitoring.
• Securing efficiency and stability of IT operation by enabling integrated monitoring of various environments.