All-in-One Monitoring Solution
Providing Full-Stack Observability
exemONE, our All-in-One integrated monitoring solution, adeptly collects and manages data from various IT systems, providing observability for analysis, tracking, and streamlined monitoring.
One Platform Solution
exemONE empowers Full-Stack Monitoring and offers flexible dashboard configuration across all system domains, spanning Infrastructure, Kubernetes, Applications, Databases, and Logs.
-
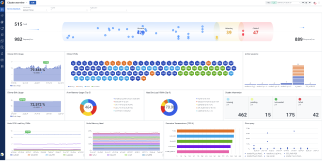
Infrastructure
MonitoringGather and analyze
performance metrics across
infrastructure environments. -
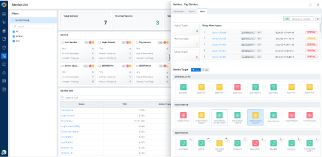
Kubernetes
MonitoringKubernetes overview and
detailed monitoring by nodes. -
Application
MonitoringOpenTelemetry with
proprietary agent-based data
collection. -
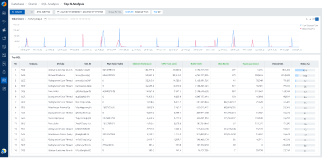
Database
MonitoringComprehensive monitoring
through optimized queries. -
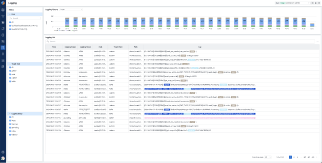
Log
MonitoringIn-depth analysis of historical
linkages through various log
collections.
Features
exemONE leverages EXEM's existing point monitoring solutions' data collection method through its proprietary agents. Built upon years of technological expertise and stability garnered from customer environments, it integrates and manages diverse IT system data outputs into a unified platform. This enables swift recognition and accurate analysis of problem situations.
-
-
One Platform Supports
Diverse IT Environments -
Centralized monitoring
of complex systems
-
One Platform Supports
-
- Unified Monitoring
-
Comprehensive monitoring
of all areas
-
-
AI Anomaly Detection
and Analysis -
Automatic detection of
system anomalies through
anomaly detection and analysis
-
AI Anomaly Detection
-
- Mobile App
-
Real-time monitoring and
fault management without
space or time constraints
-
- Data Correlation Analysis
-
Accurate diagnosis and
report provision through
data correlation
-
- High-Speed Distributed
Data Processing -
Verified data collection
and analysis
- High-Speed Distributed
-
- Query Engine
- Customizable metrics support
-
-
Real-Time Event
and Alarm Integration -
Alert settings for
all performance metrics
-
Real-Time Event
Identify Various Infrastructure and Services
on One Screen with View Pack.
Monitoring Views
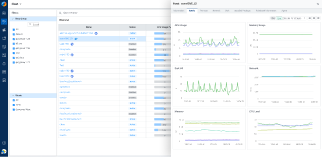
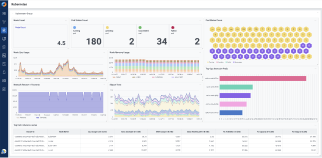
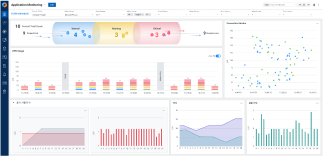
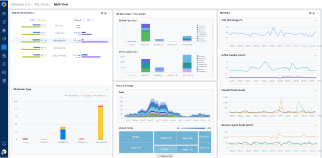
Integrated Analysis Views

Architecture

Customer Cases
-
Manufacturing
National Citizen System
Adoption Background
Need for integrated monitoring of Global Service systems built in on-premise and cloud environments.
Benefits
• By establishing integrated monitoring for on-premise and cloud (AWS, Azure) multi/hybrid environments, we ensure the efficiency and stability of IT operations through centralized management.
• We perform monitoring and analysis of major events in target databases (MySQL, MariaDB, Oracle, Aurora, SQL Server, NoSQL, etc.), enabling rapid detection and resolution of issues when failures occur.
• We monitor over 100 RDBMS simultaneously, from open-source DBMS to commercial DBMS, contributing to increased management efficiency and cost savings.
-
Public
AI Publications
Adoption Background
Monitoring the operation of national public projects built on the NCP (Naver Cloud Platform) Cloud DB environment is required.
Benefits
• Monitor cloud logs, database logs, and OS resources in the NCP public cloud environment.
• Enable rapid problem detection and response with SMS/email notifications through API linkage.
• Ensure security that meets public requirements, including separation of webpage users/roles/monitoring targets and Docker security vulnerability measures in the collection server environment.
• Enhance monitoring convenience by grouping instances by business unit (a total of 123 units).
-
Online Service
E-commerce System
Adoption Background
As the use of Cloud DB increases, difficulties in performance monitoring and management gradually occur, and then we were trying to find a solution which can help us derive causes/analysis when bottlenecks arise.
Benefits
• CPU usage reduction by SQL tuning.
• Reducing I/O-related costs by transferring low-critical tasks to RDS.
• Transferring backup object data deriving objects with high I/O-related indicators in a specific time period.
• Cost savings of KRW 570,000 per day on average and KRW 17 million per month after the adoption.
-
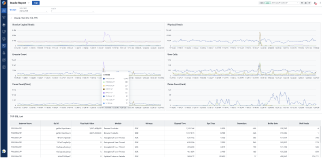
Bank
Private PaaS-based
Kubernetes Integrated
Operating System
Monitoring ImplementationAdoption Background
With the first-time implementation of a cloud system, there is a growing necessity for integrated monitoring of IaaS, PaaS, and MSA to ensure optimal performance and availability.
Benefits
• Implementation of private PaaS-based Openshift operating system monitoring and failure detection.
• Configuration of integrated failure alarm through health check function linkage including IaaS and PaaS areas.
• Analyze pod lifetime log and cause analysis through Container Lifecycle function.
• Securing infra operation efficiency with rapid change detection and insight for auto scale environment.
-
Financial
Integrated Multi-public
Cloud Operating
System MonitoringAdoption Background
Necessity for integrated management of various public cloud environments.
Benefits
• Provide an integrated dashboard for customer service performance and failures in a distributed cloud environments.
• Securing operational convenience through integrated monitoring of multi and hybrid clusters.
• Performance improvement effect through real-time active transaction monitoring of MSA-based applications.
• Effect of IT operation cost reduction through efficient operation and management of cloud infrastructure.
-
Private Cloud
(IDC Center)Integrated
Monitoring EstablishmentAdoption Background
Necessity of efficient integrated monitoring of cloud systems in an IDC environment that provides SaaS services.
Benefits
• Establishment of HCI platform environment-linked monitoring for bare metal containers.
• Performance improvement effect with real-time detailed trace monitoring for MSA applications.
• DevOps support by providing cluster integration and individual monitoring for each development and operation service.
• Integrated operation and management efficiency of the IDC center via 3D integrated view.