- MaxGauge for Java
- WEB-WAS(Web Application Server)-DB integrated
performance monitoring solution for application
performance management

Introduction
In most traditional monitoring systems time is not used efficiently. In order to reflect customer needs in an IT business environment as quickly as possible and to minimize the resulting service response time, it is essential that standard and integrated data are available to assist operators in each segment in efficient communication.
- Solution verified by large manufacturers, financial and public institutions
- Essential solution for DevOps monitoring environment
- WEB-WAS-DB integrated monitoring solution
MaxGauge for Java is a performance management solution for WAS middleware-based web applications, JAVA daemon applications, and .NET-based applications. It enables you to monitor and analyze application performance at all stages, from development to performance testing, application launching and continuous stabilization. In particular, it is the only solution that enables detailed WEB-WAS-DB session linkage analysis.
- Client
(Browser) - Web
Server - WAS
- TP Monitor
- Database
- External
Side
Features
MaxGauge for Java is designed with a stable and proven architecture that can scale horizontally even when controlling large-scale systems in finance, the public sector, communications, and manufacturing. In particular, it provides the fastest detection of performance degradation and bottlenecks for real-time transactions, and the root cause of problems when they occur.
- WAS-DB Real-time Integration
- The cause of the delayed query can be identified by simultaneous integration of the active transaction from WAS and the session information from DB
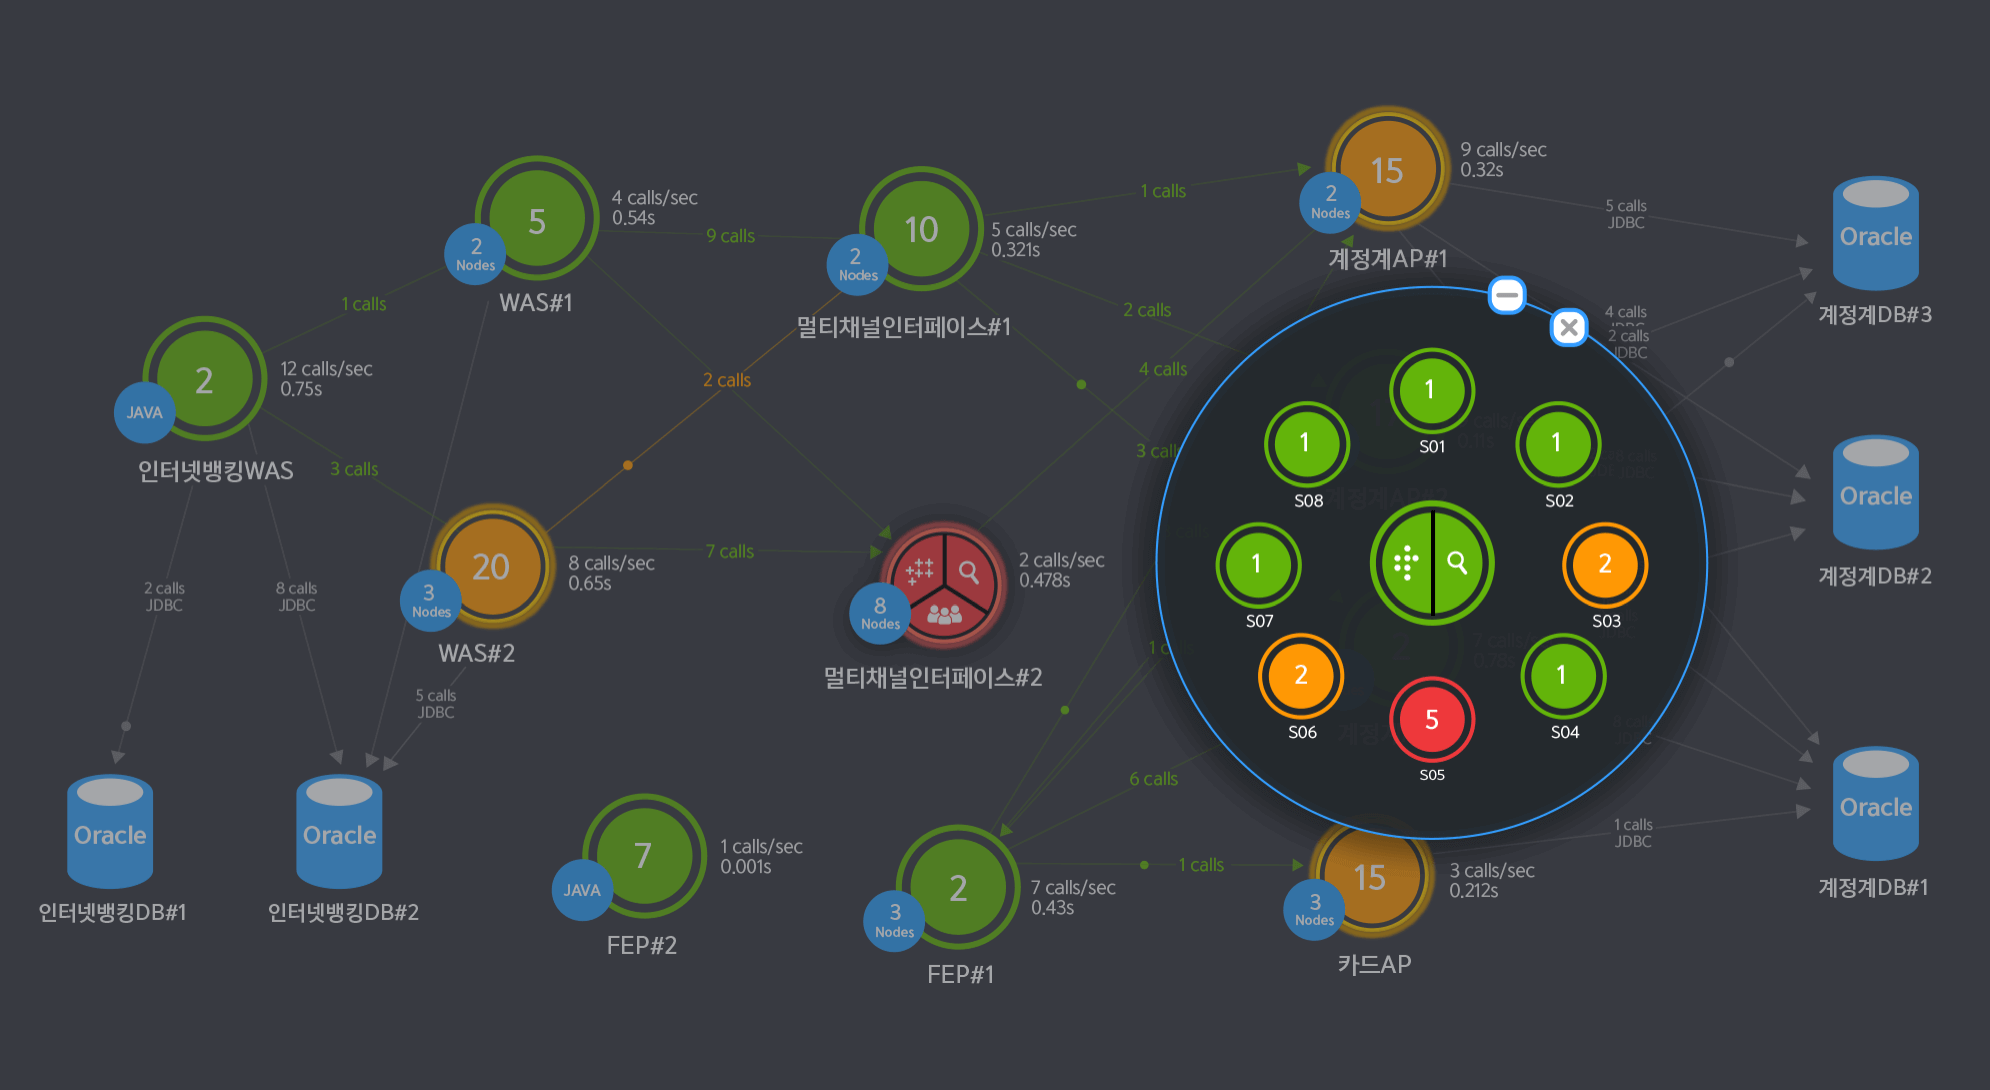
- Topology View
- Understand the status of real-time transaction processing between all system nodes and monitor external linkage service connected with WAS.
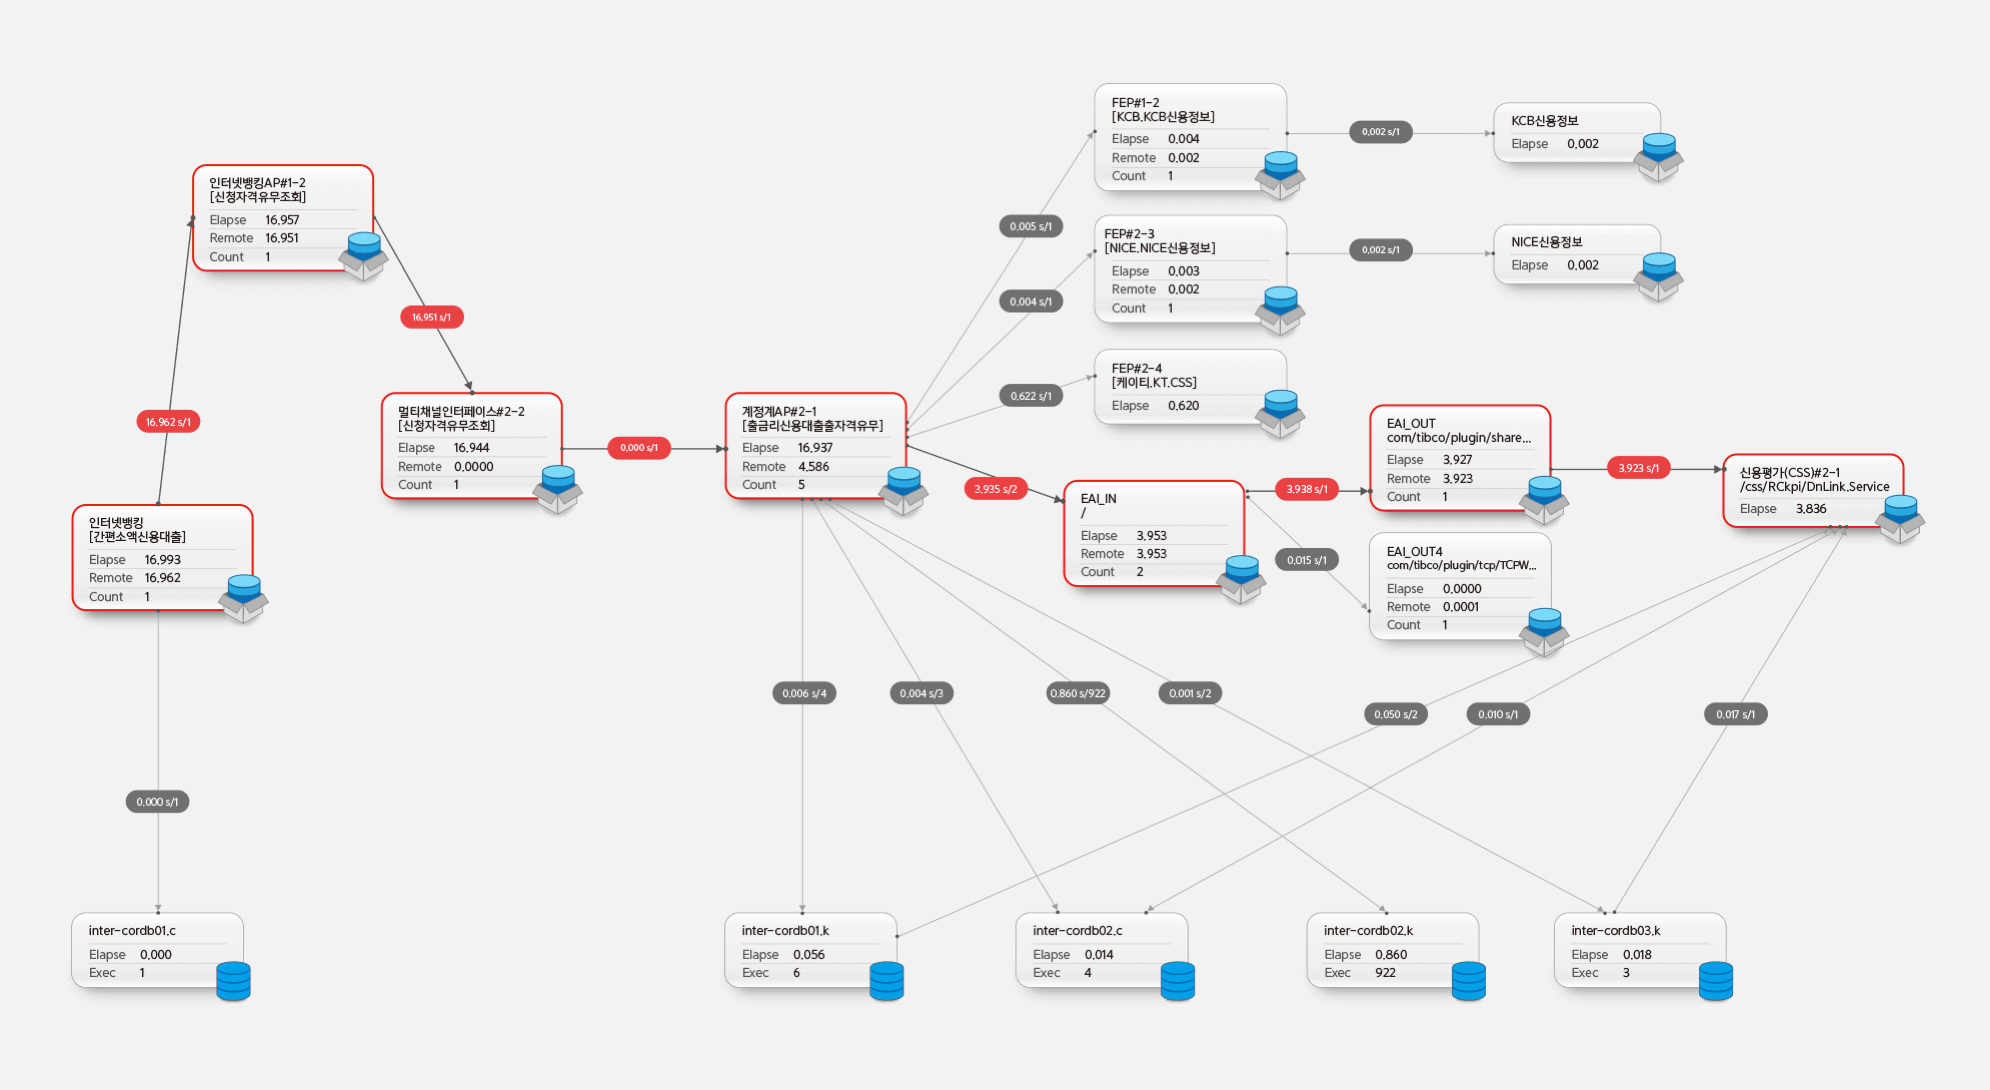
- Transaction Path View
- Identify the delay intuitively through the individual transaction unit path flow and the interval (WEB-WAS-DB) response time
- Memory leaks tracking
- Tracking / Analyzing Memory Leaks in Transaction-Triggered Collection Objects
- Ranking analysis
- Analysis of the changing status of SQL and transaction execution by day / period
- Root Cause Analysis
- Intuitive UI for root cause analysis and performance issues with just a few clicks
- Transaction snapshot information in seconds
- Collect / store active transactions and status information in seconds
- Professional database monitoring
- Provides the same expert DB performance information as MaxGauge.
Architecture

Solution
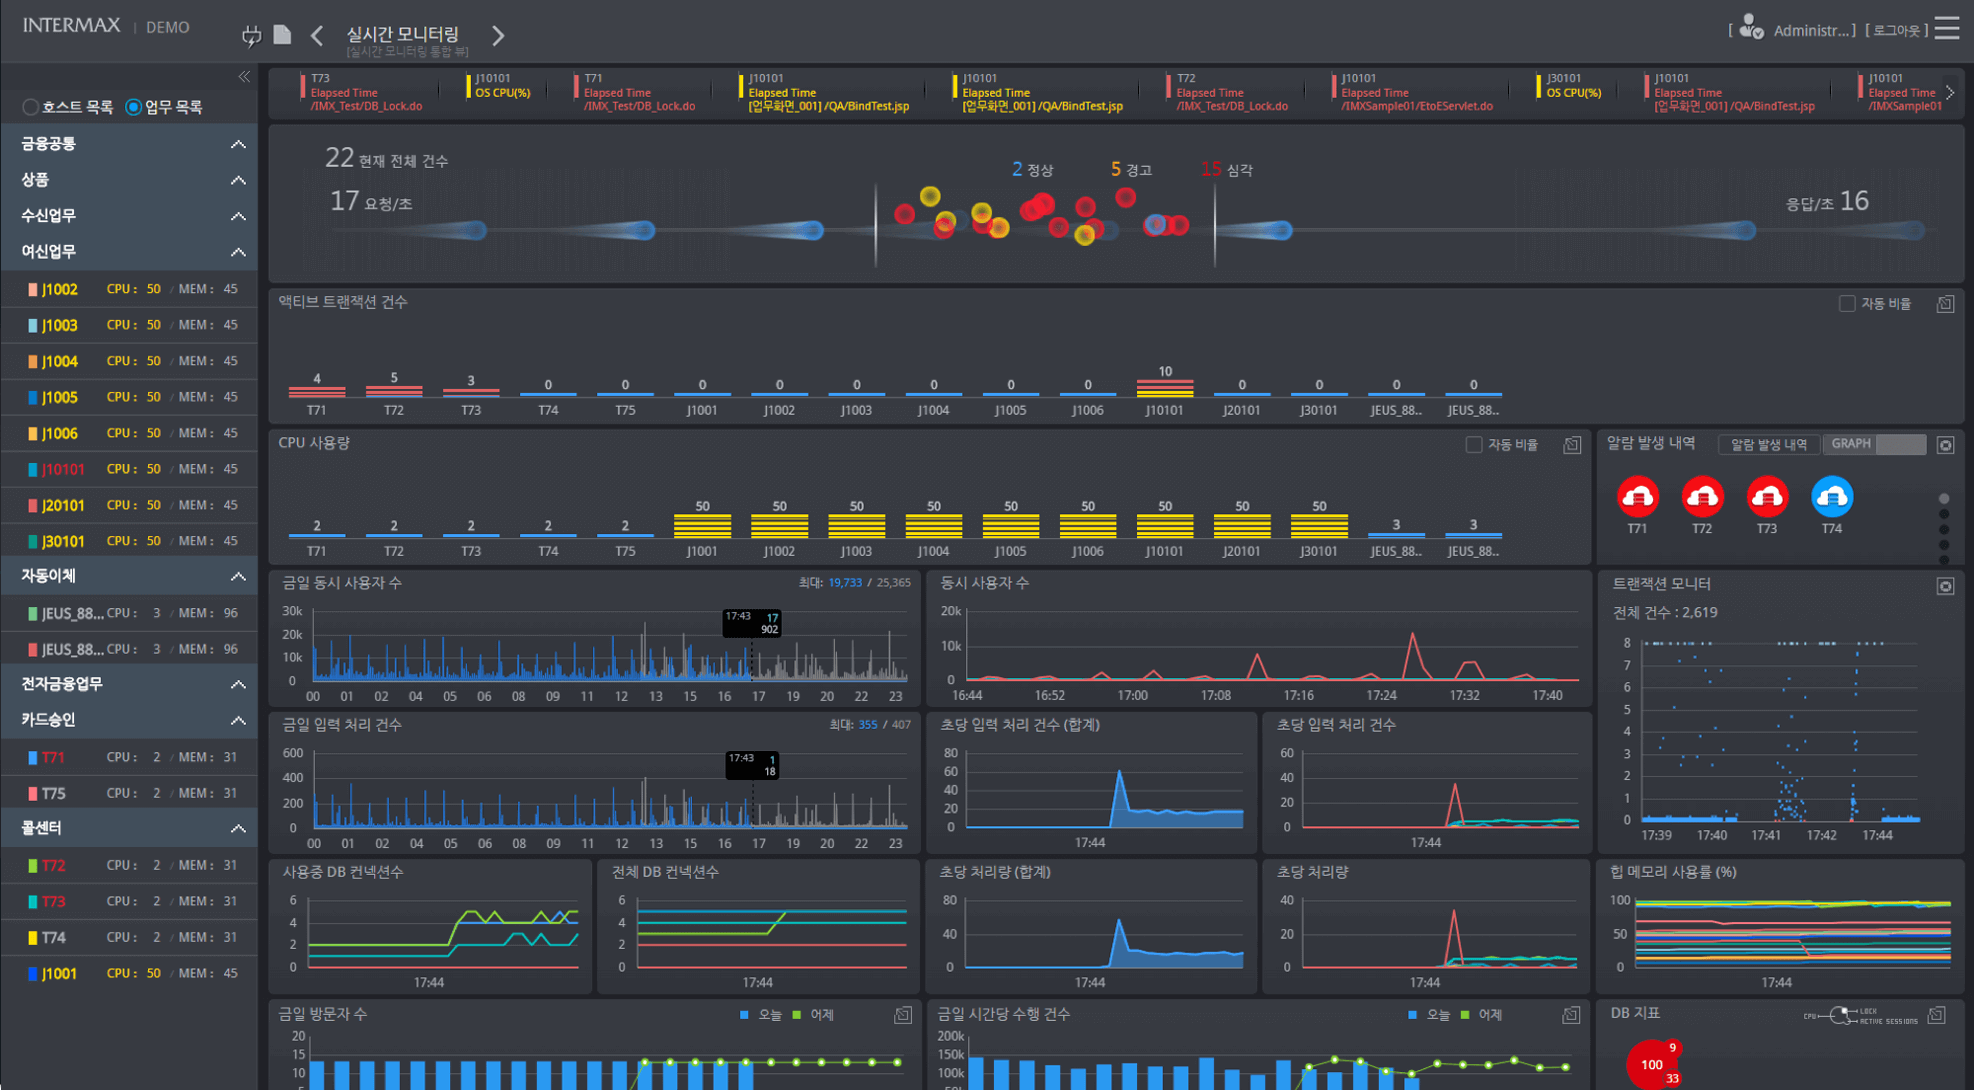
- Real-time monitoring with dashboard, topology views and transaction path views
- "Internet banking service is an important service for our customer's finances, so management of related systems is very important. In addition, issues such as interlocking transactions with other banks are generated in real time, so if we do not pay attention to this monitoring, our customer satisfaction level will drop significantly."
- Transaction performance management and root cause analysis of operating systems
- "Suddenly, in the event of a serious failure that slows or stops service response time, it is often difficult to find the cause. It is time-consuming to analyze the log of the solution data and equipment, and if multiple systems are connected, there is a limit to diagnosing the root cause of the failure."
- Understand the operation status of integrated system
- MaxGauge for Java enables real-time monitoring of system operations for JAVA-based environments. In addition, through the Transaction Path, Call Tree, and Execution SQL for individual transactions, when a performance delay occurs, it is easy to analyze the delay of transaction processing and find its origin and cause. The topology view provides real-time detection of errors and tracking of unfinished transactions to facilitate analysis and response to system failures.