- MaxGauge
- The New MaxGauge is now Faster,
Smarter and Easier to use!

Introduction
Diagnosing the exact cause of a database problem is more important than solving it. Recently, it has become very common for databases to have many users viewing large amounts of data under a variety of conditions. Thus, database performance problems can be manifested in many forms in different environments for different reasons.
- 4000 Database servers are using MaxGuage
- 450 Clients in 29 countries
- 300 Purchase of licenses from one client
MaxGauge is a professional software solution for database performance management and helps to effectively manage the database system's availability and performance. It provides pro-active monitoring techniques which help to recognize problems quickly and analyze bottlenecks in applications effectively, and stores up various performance data to provide a clear analysis report.
Features
MaxGauge provides real-time monitoring with a highly detailed analysis of detected problems. All performance data is collected and monitored with minimal load. With improved UX, user friendliness is always our top priority.(Google+Introduction)
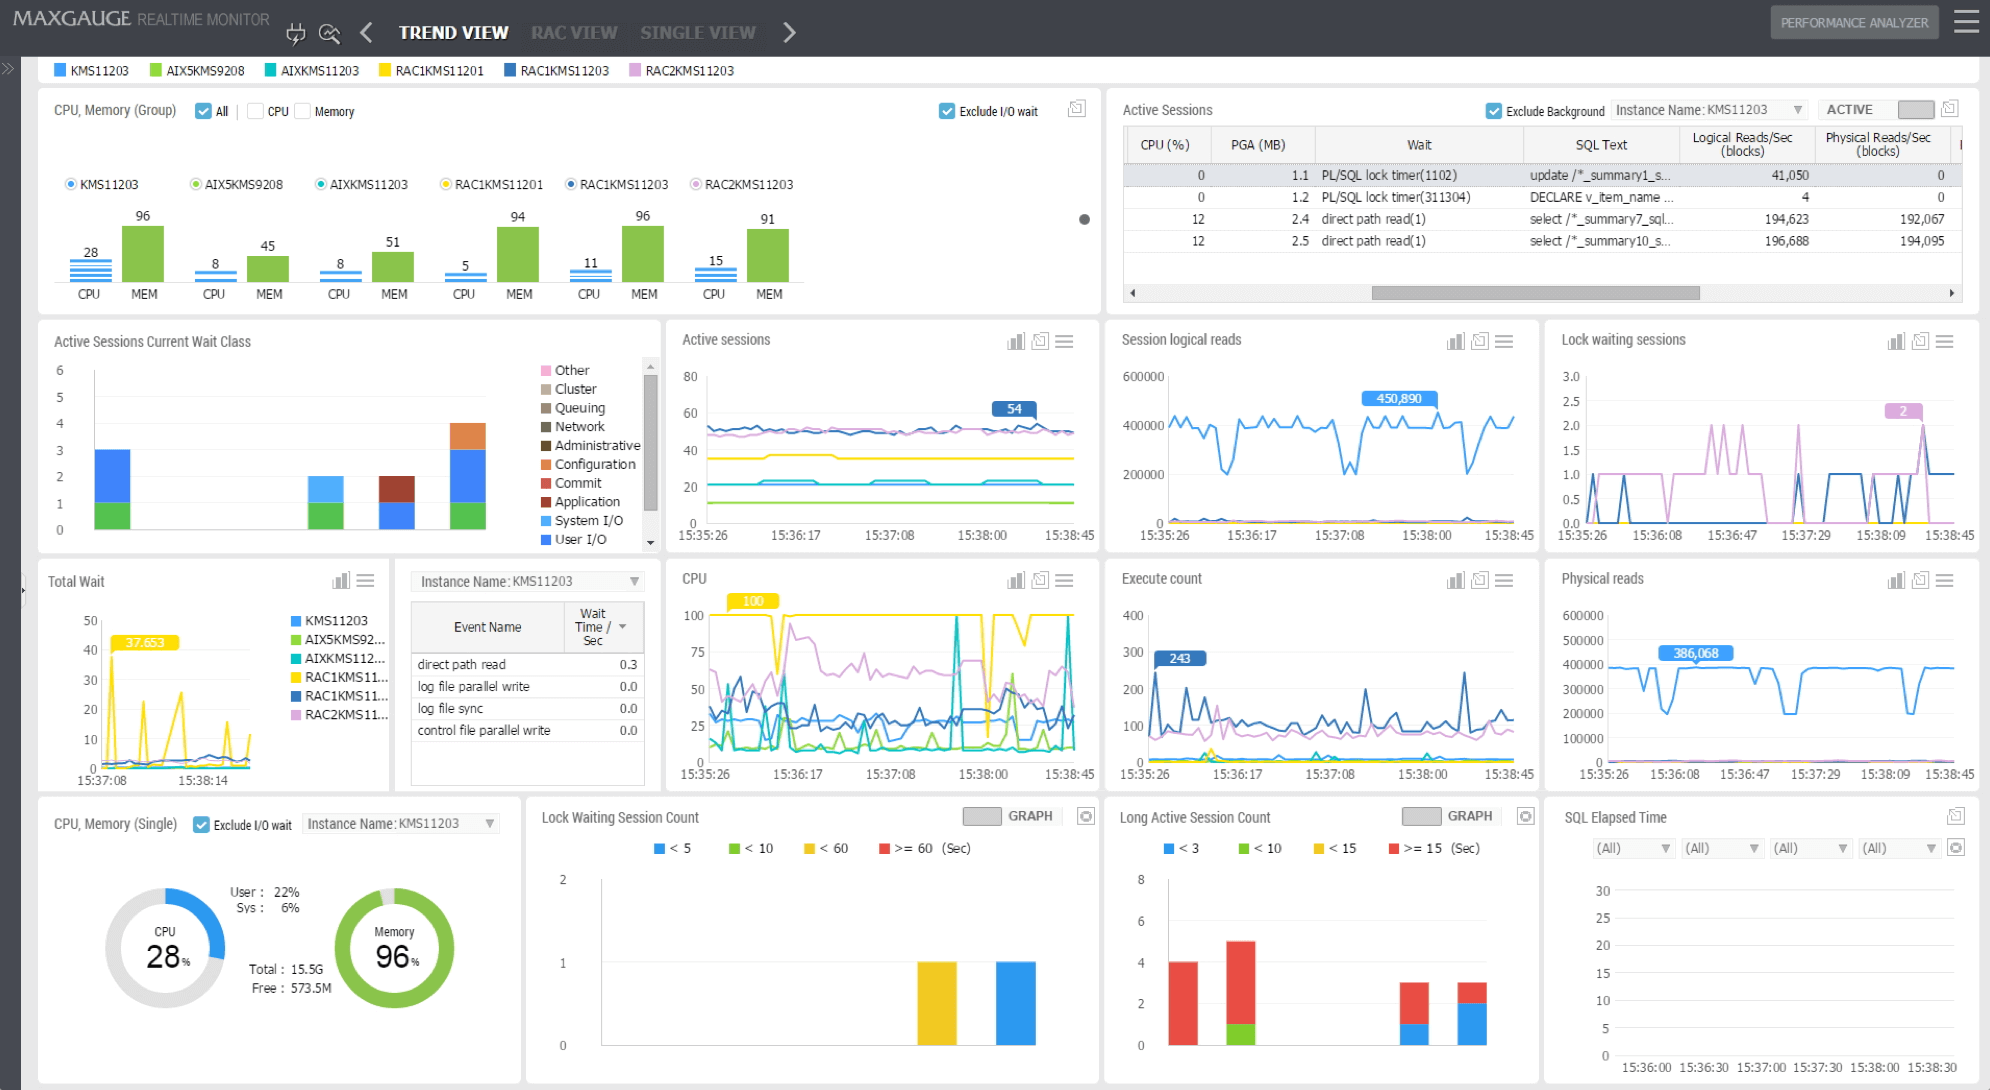
- Real-time monitoring
- Real-time monitoring of various performance indicators
- Direct Memory Access
- Monitoring and analysis in DB Hang status
- Store data in 1 second
- Precise analysis in real-time
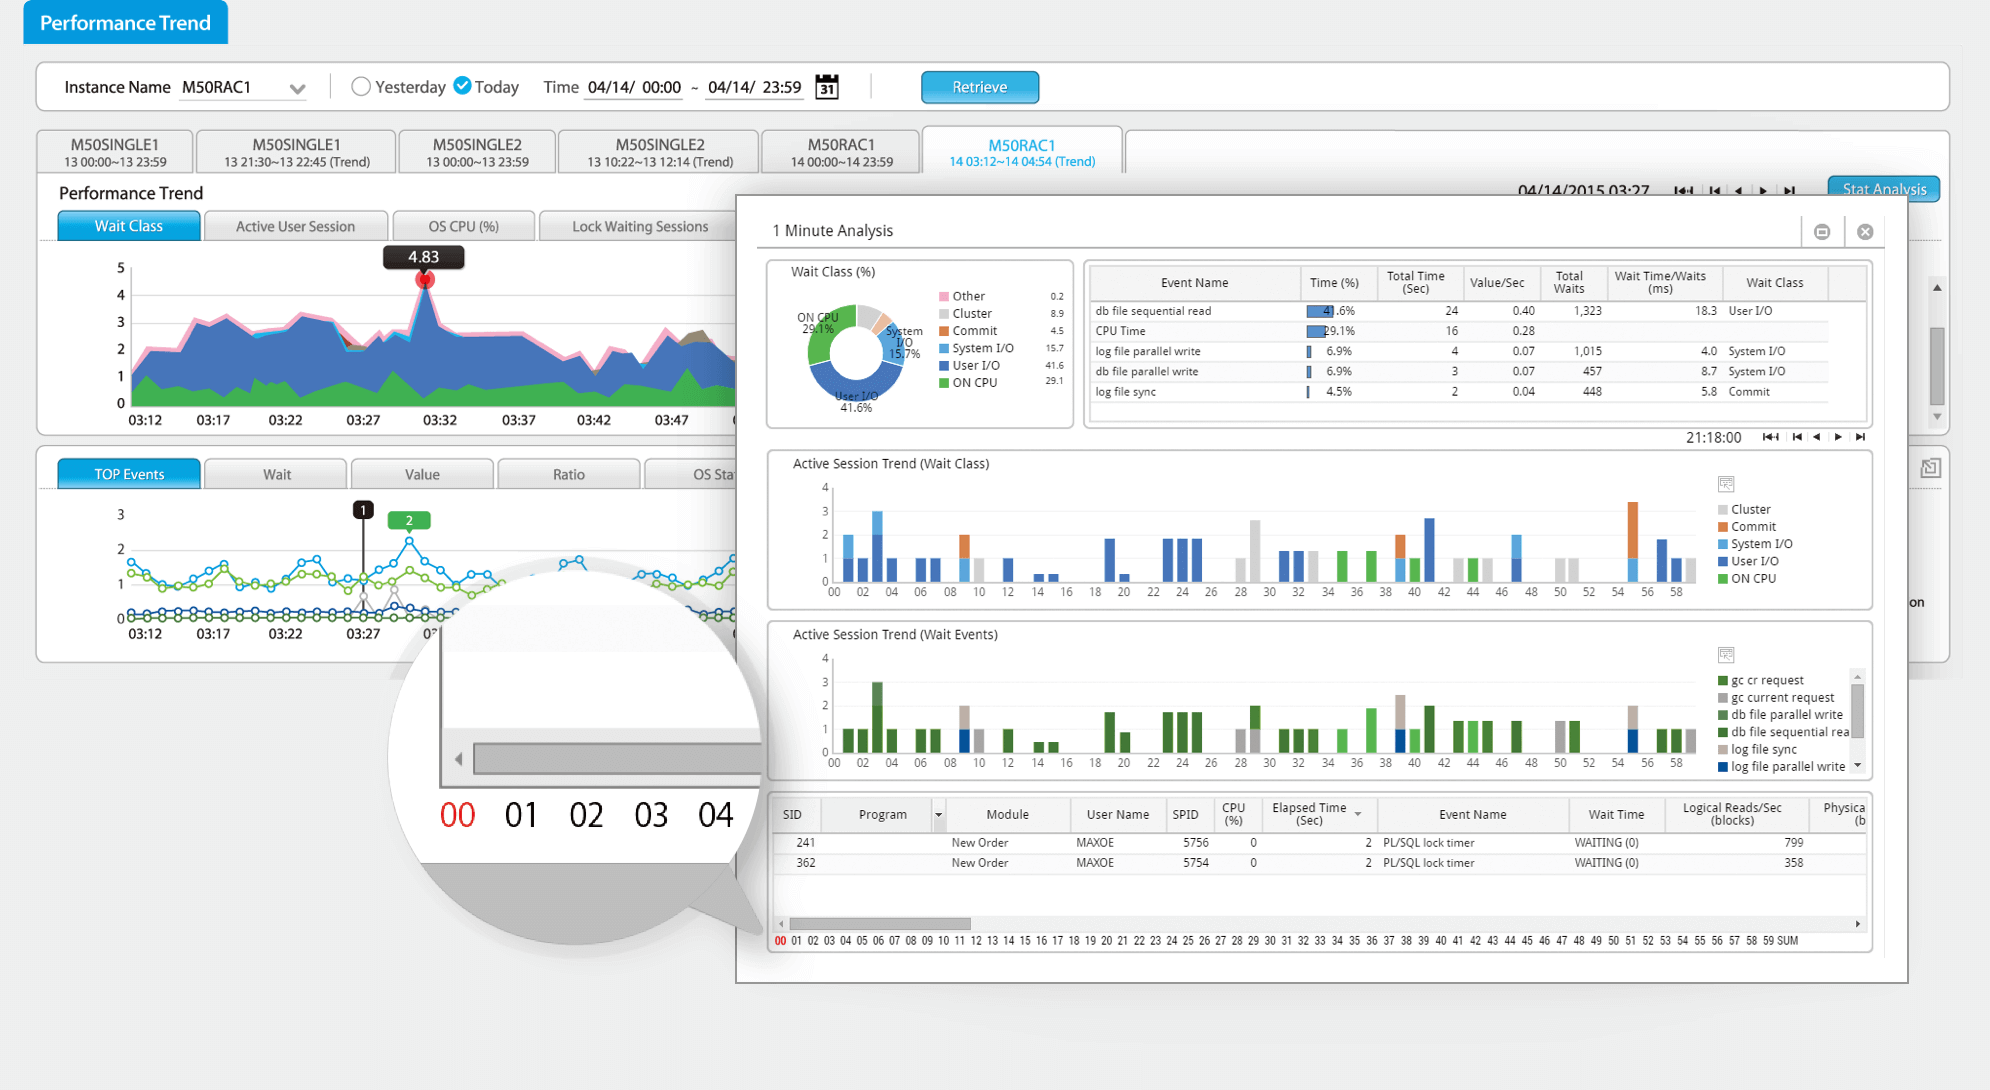
- User Interface
- Identify problem situations through top-down approach
- Provide various
analysis methods - Analysis of data visualization techniques
- Provide various
- Alarm notification
through SMS - Set alerts for all performance indicators, SMS/Mail integration
- Alarm notification
- User management
- Set accessible IP band, DB list, permissions
- DB performance report
- Daily/periodic reports in various formats
Architecture

Tech Spec
Solution
- Prevent significant cost due to
manufacturing line outage - Manufacturing Execution System (MES) services are important to manage the entire automated manufacturing process. In particular, we run a database server and storage pool with over 350 databases If there is an error in the MES service, the manufacturing line is interrupted and can cause a lot of losses in a short time. The primary function of the MES service is to prevent errors, and if there is a sudden unexpected failure, the root cause will be quickly identified to reduce the loss.
- Maximize database performance with tuning
- In addition to minimizing downtime by finding and resolving the cause of the error quickly, it is possible to maximize database performance through SQL identification and tuning.
- With MaxGauge
- Without MaxGauge
| Performance | AS-IS | TO-BE |
|---|---|---|
| Elapsed Time/exec | 93.6 sec | 5.5 sec |
| Logical Blocks/exec | 681,463 sec | 6,000 sec |
- 700,000
- 600,000
- 500,000
- 400,000
- 300,000
- 200,000
- 100,000
- 0
- #1
- #2
- #3
- #4
- #5
- #6
- #7
- #8
- #9
- #10
Customer Tuning Results