Standard Solution for Database Performance Management
in Korea
As a professional solution for database performance management, MaxGauge is specialized in efficiently managing the availability and performance of database systems.
By providing Pro-Active monitoring techniques, it quickly recognizes problem situations and effectively analyzes application bottlenecks to provide clear and accurate analysis data.
No.1 Solution in Database
Performance Management
No.1 Market Share in Financial Sector
Delivered to 800 Large Customers
Global Contracts with Clients
Over 29 Countries
Features
MaxGauge provides a very detailed analysis of bottlenecks detected through real-time monitoring. What’s more, it is designed to collect and monitor all performance data with minimal load.
Real-time Monitoring
Provide observation for various
performance indicators in real time
Direct Memory Access
Provide monitoring and analysis even when
the database is experiencing downtime or
hanging situations
Data Collection in 0.01 Second
Precise analysis by collecting data as in real
time and saving it in 1 second unit
Smart Analysis
Automatic detection and reporting/mailing
function provided when
performance deterioration occurs
Alarm/SMS Connection
Provide alert setting for all performance
indicators, and SMS/Mail connection
User Management
Setting for accessible IP range,
DB list, user permission
DB Performance Report
Provide user-friendly daily/periodic
indicator reports
Commercial/Open-source DBMS Support
Oracle, DB2, SQL Server, Tibero, Altibase,
MySQL, PostgreSQL, MongoDB, SAP HANA
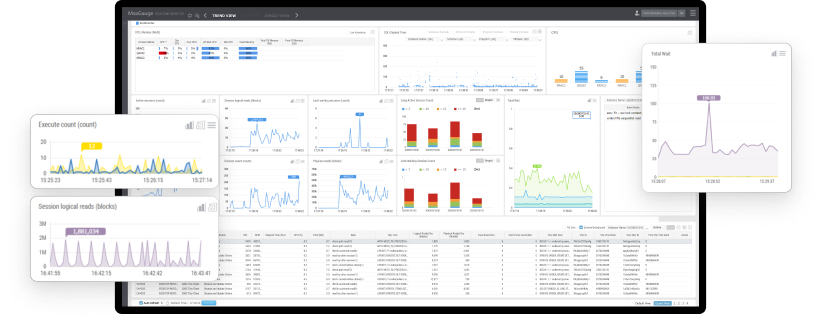
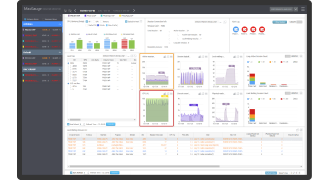
Monitoring Views
Session Monitoring
Real-time session information is provided as a list, and detailed information can be checked simply by a mouse click. Database wait status and session intensive monitoring are also helpful to DBAs.
· Grouping Active Session / Lock Waiting Session by time unit
· Provide performance information on Parallel Query in a tree structure of Coordinator and Slave sessions
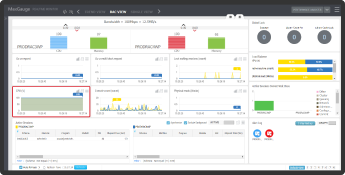
RAC Monitoring
RAC View is a monitoring screen dedicated to RAC, and you can easily grasp information on Global Lock, Load Balance, and Network usage.
· Global Lock: Real-time check when lock occurs on RAC and provide lock tree linkage
· RAC View: Check Active Sessions information simultaneously on one screen
· Load Balance: Balance check by indicators between RAC nodes and they can be easily changed
· Provide monitoring of OS, memory information and network packet amount between RAC interconnects
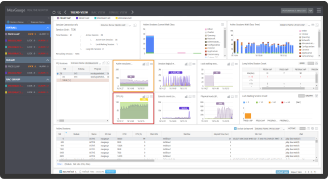
Resource Monitoring
CPU and Memory information of all database servers being monitored are provided in three forms: Multi/Group/Single.
· Provide trend for total waiting time by instance and waiting time by event
· Easy check for top process list of the server through Process Monitor
· Provide Oracle SID information of processes used by Oracle and can be linked with Session Detail
Lock Monitoring
Provide the number of sessions grouped by lock waiting time range and the relationship between lock holder and waiter in a tree structure.
· Provide Global Lock information in the case of RAC/TAC
· Lock related alarm is provided by setting lock occurrence time
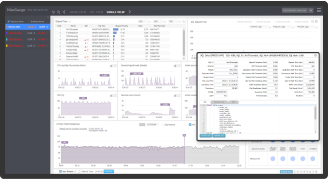
SQL Monitoring
SQL Elapsed Time displays the SQL execution time per instance as a dot and each dot represents the completion of SQL execution. In addition, by linking with Full SQL Text, the Top-10 SQL list by performance (Elapsed Time, Buffer Gets, Disk Reads) of the instance being monitored and the corresponding SQL information are provided.
· Provide individual SQL execution history, SQL Full Text, SQL Plan, Bind information, etc.
· Drag SQL Elapsed Time chart -> Select/Click SQL List -> Check SQL Detail information
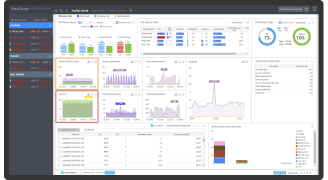
Analysis Views
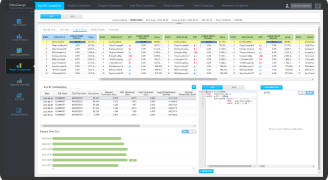
Summary View
Provide hourly average trend graphs on a daily basis for key performance indicators and waiting classes, so that peak times can be easily identified.
· Check Top Schema, Program, Module, and SQL for different time periods on a day.
· Check Executed Top-N data and SQL execution per waiting event for different time periods.
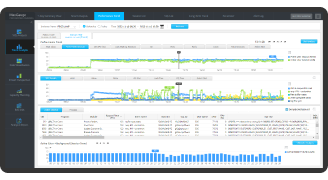
Performance Trend
As one of MaxGauge’s representative analysis screens, performance trend allows users to precisely analyze diverse troubles while enabling trend analysis of DB performance indicators, waiting events, and waiting classes.
· Active session analysis with one-second logging interval
· Active session statistical analysis with one-minute/hour logging interval
· Top O/S Process analysis with one-minute logging interval
· Lock Tree Analysis
· PQ Tree analysis
· Peak section statistical analysis
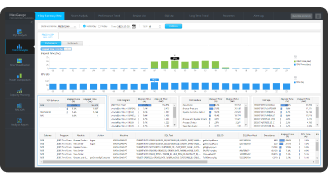
Top-SQL Comparison
MaxGauge provides a Ranking View according to changes in SQL workload by selecting the date to be compared with the standard date. If you select a specific SQL, you can check the daily ranking change and SQL performance information (Elapsed Time, CPU Time, Wait Time, Logical Reads, Physical Reads) at the same time.
· Comparison and analysis of Top SQL targets compared to the base date by 1:M, N:M
· Provided long-term trend analysis in connection with the Long-Term Trend function
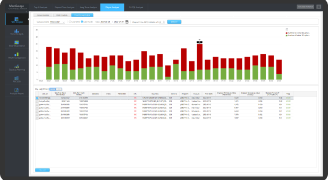
Plan Change History
The number of performance degradation and improved SQL cases due to SQL execution plan change can be checked with ease through SQL Plan Change History and Analysis.
· Comparison of SQL Plan change history and execution time by date: Red represents the number of slow response times/Green represents the number of fast response times
· SQL Plan Diff function: Compare two SQL execution plans and provide information before/after SQL plan change for a specific SQL
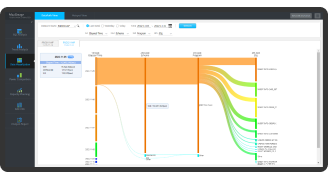
DataPath View
Provide weight analysis for multiple instances or multiple dates and bi-directional linkage analysis between instances, schemas, programs, modules, and SQL.
· Flow Visualization technique is provided as data visualization
· Instance/Schema/Program/SQL can be compared visually and easily
· Possible to analyze the relationship between different data
Architecture
Customer Cases
Electrical
Transmission and Substation System
Adoption Background
Necessity for checking and improving DB status due to system aging and continuous service increase, that’s why we need to check and improve DB status.
Benefits
• Improving response speed through pre-detection of troubles in critical core systems, reducing system downtime and failover time.
• Reducing CPU utilization by more than 30% through extracting Top SQL for a specific period.
• Reducing more than 90% of waiting event occurrence time in specific time zone.
• Helped clients save about KRW 1.41 billion 5 years after adopting the solution.
Public
Transportation Management System
Adoption Background
Performance analysis and improvement are urgently needed due to continuous service delays and increasing complaints from customers.
Benefits
• Check periodic lock occurrence status through real-time monitoring and take immediate action and analysis.
• Resolve lock occurrence by changing batch operation logic and execution time.
• In terms of performance management, MaxGauge provides more information than what we were looking for without putting a load on the system.
Elevate Your IT Stability,
with EXEM Solutions.
Thank you for your contact
and we will reach out to you soon!